Sixth post in the HPE OpsRamp track. O-5 tested whether “unified observability” holds up once the estate spans on-prem and public cloud. This post tests the same claim from a different angle: does OpsRamp actually give you all three observability data types — metrics, logs, and traces — or is one of them thinner than the marketing implies?
Restating the pillars
O-4 named the three capabilities that sit alongside monitoring templates in HPE OpsRamp Software (OpsRamp): Log Management, Distributed Tracing, and Metrics Explorer. That post treated them as a list. This one opens each of the three up individually, because “we have logs and traces too” and “logs and traces are load-bearing, first-class capabilities” are very different claims, and this track has already learned (O-5, the GCP integration gap) not to assume the stronger one without checking.
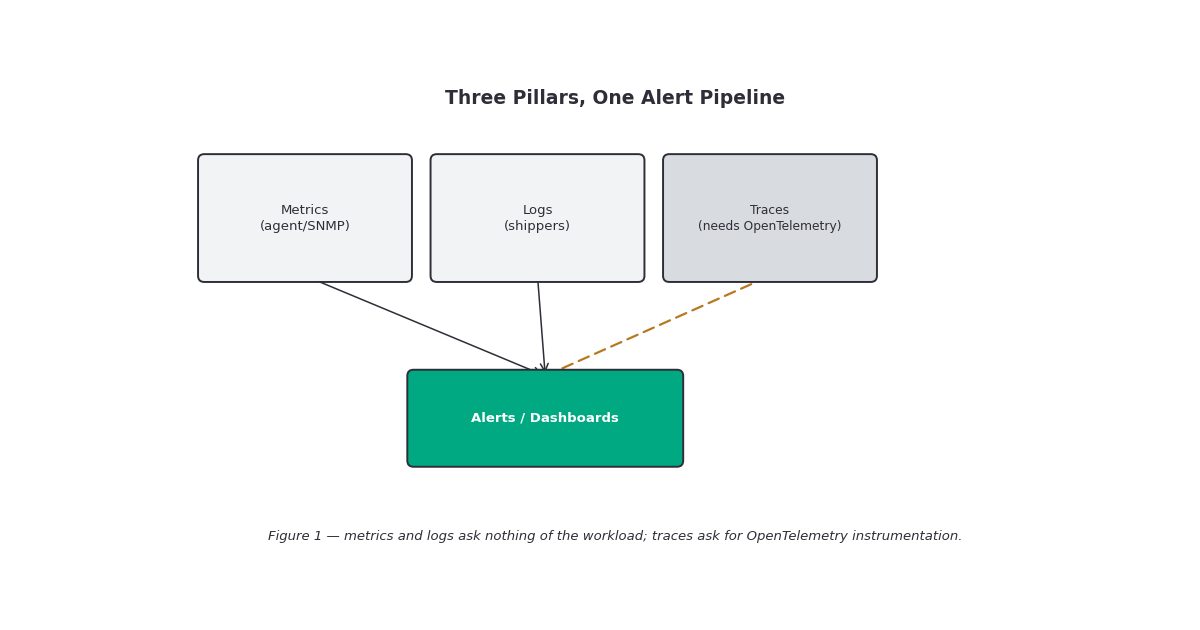
The short version, ahead of the detail: metrics and logs are collected the same way as everything else in this track — passively, via agents, gateways, and integrations, with no changes required to the thing being monitored. Traces are different in kind, not just in maturity. They exist as a real, native OpsRamp capability, not a bolt-on integration — but they depend on the application speaking OpenTelemetry, which is a decision an app team makes, not something an infrastructure team can enable on their behalf. That distinction matters more than a maturity score would.
Metrics: already covered, now queryable ad hoc
This track has been describing metrics since O-3 and O-4 without naming them as a pillar: monitoring templates define which metrics get collected, at what interval, and what threshold turns a value into an alert. That’s resource-level, template-driven, and it’s the backbone of everything else in the platform.
What O-6 adds is Metrics Explorer, documented as a beta feature for ad-hoc metric discovery — search for a metric by name or keyword across servers, applications, and cloud resources without a pre-built dashboard or template, filter by resource and attribute, compare time periods, and save what you find straight to a dashboard. OpsRamp also documents MetricsQL as the query language behind it. Functionally, this is the same relationship a Prometheus/Grafana shop would recognize between raw time-series storage and an ad-hoc query console: the template pipeline decides what’s collected and alerted on; Metrics Explorer is where you go to answer a question the templates weren’t built to answer, without waiting for someone to build a dashboard first.
Logs: broad ingestion, a real query layer, and a metrics escape hatch
Log Management is the most conventionally “SIEM-adjacent” of the three pillars, and the most fully documented of the two newer capabilities in this post. Confirmed from docs.opsramp.com:
| Capability | What’s documented |
|---|---|
| Ingestion | 40+ sources — cloud platforms (AWS, Azure, GCP), databases (MongoDB, MySQL, Oracle, MSSQL, Cassandra), web servers (Apache, Nginx, IIS, Lighttpd), message brokers (Kafka, ActiveMQ, RabbitMQ), log shippers (Syslog, Fluentd, Logstash, rsyslog), containers (Docker) |
| Search/query | Logs Explorer — search and filter by application type, timeframe, and severity; saved views and an advanced query builder |
| Log-derived metrics | Custom metrics built from LOGQL queries against log content, distinct from standard resource metrics — plus built-in service metrics like log_archival_health for ingestion-rate and archival monitoring |
| Retention/archival | Log Archiving forwards logs to your own cloud storage (Amazon S3 confirmed) for long-term retention — up to 10 archival configurations per tenant, filter-based routing, individual enable/disable toggles |
Two things stand out. First, log-derived metrics are a genuine bridge between pillars: you can turn unstructured log content into a queryable time series without leaving the logging layer, which narrows the gap between “I can search for this in logs” and “I can alert on this as a trend.” Second, and more of a caveat: the documentation describes how to archive logs for long-term retention but doesn’t state a default active-storage retention window. Vet Your tenant’s default log retention period before assuming logs are searchable for as long as you’ll need them — if compliance or postmortem timelines exceed that window, the archival configuration isn’t optional, it’s the retention plan.
Traces: native, OpenTelemetry-based, and the one that asks something of you
This is where the honest framing matters most, because the obvious assumption going in — modeled on O-5’s finding that GCP parity couldn’t be confirmed — was that distributed tracing might be a documentation gap or an integration-only afterthought next to the more mature metrics and logs stack. That assumption turned out to be wrong, and it’s worth showing the work rather than just asserting the correction.
Distributed Tracing is a real, named platform capability, documented with its own architecture:
- Ingestion is via OpenTelemetry — described in the documentation as “a vendor-agnostic instrumentation library per language to generate, emit, collect, process and export telemetry data,” ingested as OTLP (OpenTelemetry Protocol) trace payloads.
- Trace Proxy is the collection tier, with three documented components: a Listener (collects, stores, and routes tracing messages), a Down Sampler (reduces sampling rate before data reaches the OpsRamp portal), and an Exporter (sends processed traces to OpsRamp’s cloud storage).
- Deployment is supported in both Kubernetes-based and host-based environments for the Trace Proxy itself.
- The Traces Explorer UI shows a hierarchical span view, average latency across the top 50 operations for a timeframe, root-entry and all-span lists (1,000 and 500 most recent respectively, paginated), a service map showing inter-service calls, and a “view related logs” link that pivots from a span directly into Logs Explorer.
- Span events can be forwarded as logs — a genuine cross-pillar link, not just a UI convenience, since it means trace context and log context can be correlated without a separate integration.
So the capability itself is not the gap. The gap — if it is one — is structural rather than a documentation shortfall: metrics and logs are collected without touching the monitored workload (an agent, an SNMP poll, a log shipper pointed at a file or endpoint), while traces require the application to be instrumented with OpenTelemetry first. That’s not an OpsRamp limitation so much as a property of distributed tracing everywhere — you cannot trace a request path through code that never emits a span — but it means tracing adoption depends on an application team’s willingness to instrument, not an infrastructure team flipping on a template. For any given estate, that makes traces the pillar most likely to be uneven in coverage: comprehensive for services someone bothered to instrument, invisible for everything else, with no equivalent of SNMP-style passive discovery to fall back on.
Where the three overlap, and where each stands alone
| Collection mechanism | Requires app changes? | Where it converges with the others | |
|---|---|---|---|
| Metrics | Agent / SNMP / WMI / cloud API, per monitoring template | No | Feeds alerts, dashboards, Metrics Explorer |
| Logs | Shippers, syslog, cloud/API log sources | No (source-side config only) | Log-derived metrics feed dashboards; span events land here from traces |
| Traces | OpenTelemetry SDK in the app → Trace Proxy → OTLP | Yes | “View related logs” pivots to Logs Explorer; spans can forward as log events |
Read across that table, the overlaps are real but partial. Traces feeding logs (span events) is a genuine, documented convergence point — arguably the strongest cross-pillar link in the platform, stronger than anything connecting metrics to logs directly. Metrics and logs converge downstream, at the dashboard and alert layer, rather than at collection. None of the three fully substitutes for another: a metric threshold tells you that something is wrong, a log tells you what happened, and a trace tells you where in the call path it happened — and only the last of those requires the workload’s own cooperation to exist at all.
Gotchas and caveats
Traces are not a documentation gap — but they are an adoption gap waiting to happen. Don’t assume tracing coverage matches your metrics/logs coverage just because all three live in the same platform. Confirm which services are actually instrumented before relying on a service map in an incident.
Metrics Explorer is documented as beta. Treat it as an investigation tool, not yet as the system of record for anything you’d build an SLA around
Log active-storage retention isn’t stated in the archival documentation. If you need logs searchable past whatever the undocumented default window is, set up archival deliberately rather than assuming Logs Explorer covers it indefinitely.
Down-sampling on the trace path isn’t fully specified. A trace pipeline that down-samples before storage can quietly under-represent rare, high-latency requests — exactly the ones worth investigating. The sampling behavior before treating trace data as a complete record rather than a representative one.
Span-to-log forwarding is opt-in (SendEvents), not automatic. Confirm it’s enabled if you’re planning to rely on trace-to-log pivots during an incident.
Key takeaways
- Metrics are the pillar this track has already covered in depth (O-3, O-4); O-6 adds Metrics Explorer (beta) and MetricsQL for ad-hoc querying on top of the template-driven baseline.
- Log Management is broad and genuinely queryable — 40+ source integrations, a Logs Explorer with saved views and a query builder, and LOGQL-based custom metrics that bridge logs into the metrics/dashboard layer.
- Distributed Tracing is native, not a gap — built on OpenTelemetry/OTLP through a documented Trace Proxy (listener, down-sampler, exporter), with span, timeline, and service-map views in the Traces Explorer.
- The real asymmetry isn’t maturity, it’s who has to act: metrics and logs are collected without touching the workload; traces require the application team to instrument with OpenTelemetry first.
- Span events forwarding into Logs Explorer is the strongest documented cross-pillar link — stronger than any direct metrics-to-logs convergence.
What’s next
Next in this track: O-7 — Dashboards and Role-Based Views. Now that metrics, logs, and traces are on the table individually, the next question is how they get assembled into something a specific role — NOC, app owner, executive — actually looks at day to day.
Sources: OpsRamp Documentation · Log Management · Use Logs Explorer · Metrics (Log-Derived) · Archive Logs · Distributed Tracing · Trace Collection · View Traces · Metrics Explorer · MetricsQL.
Pingback: Dashboards and Role-Based Views – silverX.org