Fourth post in the HPE OpsRamp track. O-3 ended with resources sitting “Undefined”. This is the piece that fixes that — and the piece that decides whether your alerts are useful or ignored.
Templates are where observability actually gets designed
Discovery is mechanical. Gateways and agents are an architecture decision you make once. Monitoring templates are where you decide what “healthy” means for every class of thing you run — and that judgement, repeated across a few hundred resource types, is your observability strategy.
Most teams treat templates as a checkbox: apply the vendor default, move on. Then six months later they’re drowning in alerts nobody acts on, and the conclusion is “the tool is noisy”. The tool isn’t noisy. The thresholds were never designed.
What a template contains
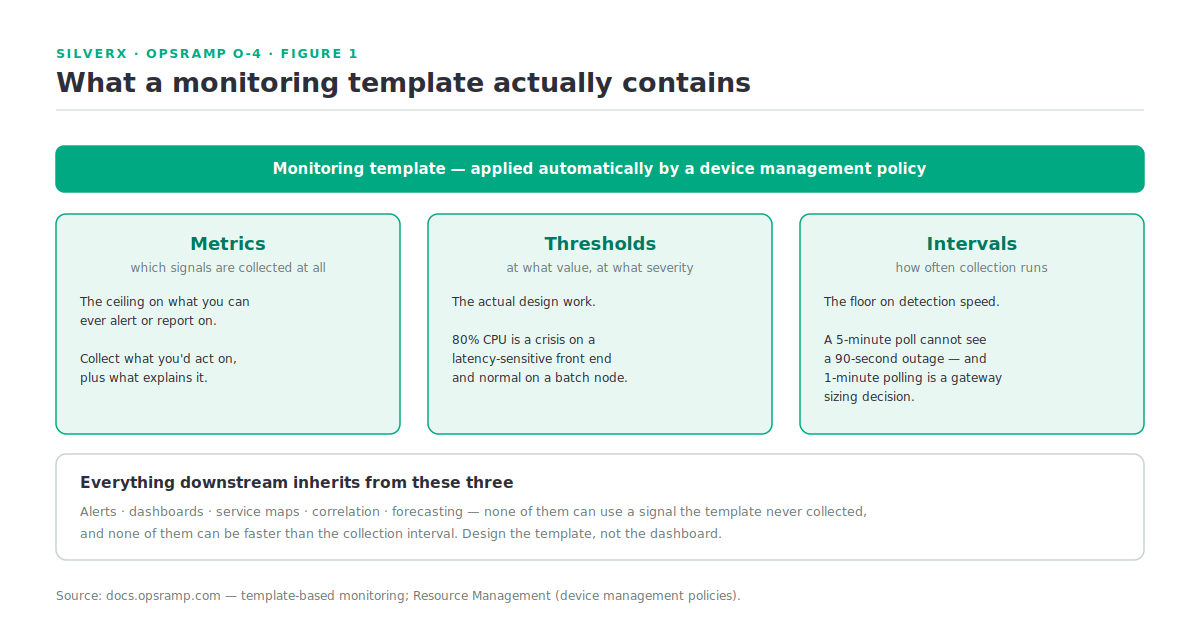
In HPE OpsRamp Software (OpsRamp), a monitoring template defines the metrics, thresholds and collection intervals for a type of infrastructure. Those three things are the whole contract:
| Element | What you’re deciding |
|---|---|
| Metrics | Which signals are collected at all — the ceiling on what you can ever alert or report on |
| Thresholds | At what value a metric becomes an alert, and at what severity |
| Intervals | How often collection runs — the floor on how fast you can detect anything |
Templates are applied either directly or, at scale, by the device management policies from O-3, which attach templates to resources automatically based on group membership. That automatic path is the only one that works past a few hundred resources.
Getting the three right
Metrics: collect what you’d act on, plus what you’d need to explain it. The instinct is to collect everything because storage is cheap. The cost isn’t storage — it’s that every extra metric is a candidate for a threshold, and every threshold is a candidate for an alert. Collect the signal you’d page on, and the context you’d want when investigating it.
Thresholds: design them, don’t accept them. A vendor default is a guess about a workload the vendor has never seen. 80% CPU is a crisis on a latency-sensitive front end and completely normal on a batch node. This is the work, and it’s why the attribute model from O-3 matters — if resources carry tier and environment, you can apply genuinely different thresholds to production and dev without hand-picking resources.
Intervals: match the interval to how fast the thing actually fails. A five-minute poll cannot detect a ninety-second outage. Equally, one-minute polling across ten thousand resources is a gateway sizing decision (O-2) that people make accidentally.
From metric to alert
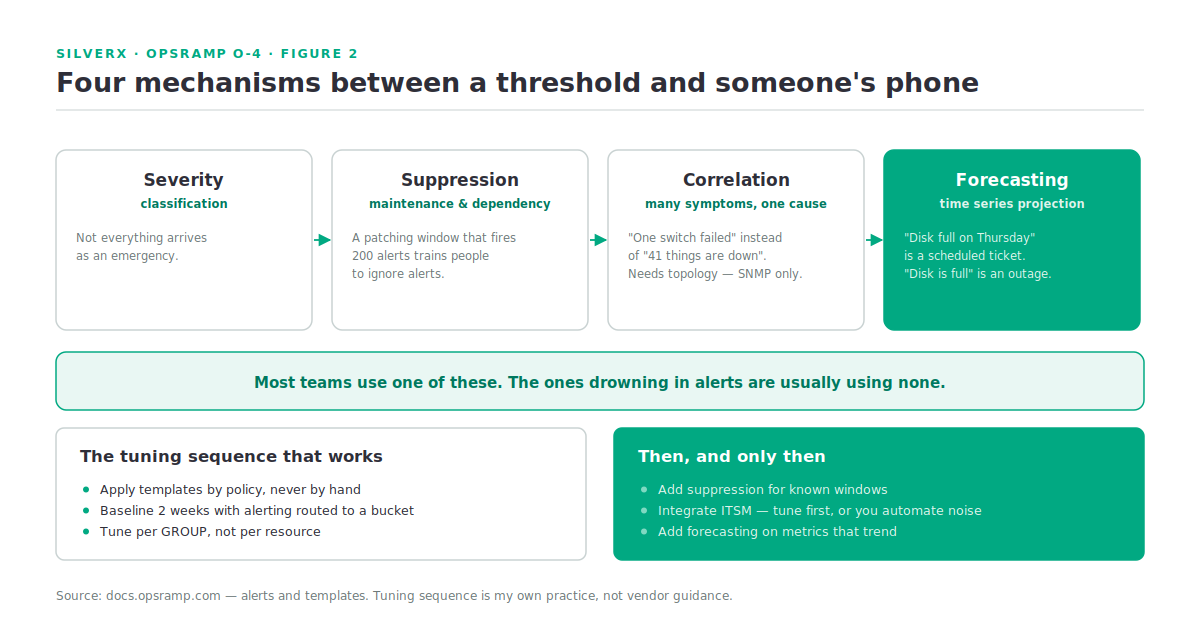
OpsRamp’s alert handling has four capabilities worth understanding before you tune anything:
- Alert state and severity — classification, so not everything arrives as an emergency
- Escalation and suppression — routing over time, and silencing what you already know about
- Alert correlation and noise reduction — collapsing many symptoms into one cause
- Time series forecasting — projecting a metric forward to alert before a threshold is crossed
The last one changes the shape of what you can do. Alerting on “disk is 90% full” is reactive; alerting on “disk will be full in four days at the current rate” is a ticket someone can schedule. Where a metric trends predictably — capacity, growth, licence consumption — forecasting is worth more than a static threshold.
Suppression is a design tool, not an admission of defeat
Two patterns worth building deliberately.
Maintenance suppression. A patching window that generates two hundred alerts trains people to ignore alerts. Suppress the window.
Dependency suppression. When a switch fails, the forty hosts behind it also alert. Correlation and topology — which, per O-3, requires SNMP discovery — are what let the platform say “one switch failed” instead of “forty-one things are down”. If network topology matters to you, that’s another reason SNMP discovery isn’t optional.
Unified observability: infrastructure to application
Templates give you infrastructure signal. The rest of the picture comes from three other capabilities in the platform:
- Log Management — centralised logs alongside the metrics
- Distributed Tracing — request paths through an application
- Metrics Explorer — ad-hoc interrogation of collected metrics
Plus synthetic monitoring for outside-in checks, and service maps and topology to express which infrastructure supports which service.
The word “unified” earns its place only when those connect. An alert on a host is infrastructure monitoring. An alert on a host that names the service it supports, with the traces showing user impact, is observability. The join is the service map — and the service map is built from the resource groups and attributes you designed in O-3.
That’s the thread running through this whole track: the attribute model you design at discovery time determines how good everything downstream can be. Templates, policies, groups, service maps, dashboards, correlation. All of it inherits from that.
A tuning sequence that works
- Apply templates via device management policies, never by hand at scale.
- Run for two weeks with alerting off, or routed to a bucket nobody pages on. You’re collecting a baseline, not responding.
- Look at what fired. Anything that fired more than a handful of times without a human acting on it is a threshold problem, not an incident.
- Tune per group, not per resource. If production web servers need a different CPU threshold, that’s a group with its own policy — not forty individual edits.
- Add suppression for known windows — patching, backups, batch runs.
- Then, and only then, integrate ITSM. Per O-2: tune before you integrate, or you automate your noise into someone’s queue.
- Add forecasting on the metrics that trend — capacity above all.
Step 2 is the one that gets cut for time and the one that makes the difference. You cannot design thresholds for a system you haven’t observed.
Gotchas and caveats
A template applied is not a resource monitored. Confirm resources actually leave the Undefined state and start reporting. If they don’t after a policy is in place, it’s usually a discovery-credential problem — the resource never grouped, so no policy reached it (O-3).
Interval changes are a gateway sizing decision. Halving the interval across a large estate doubles collection load. Check it against the sizing tiers in O-2.
Correlation needs topology, and topology needs SNMP. Documented limitation, worth repeating.
Don’t tune thresholds during an incident. It feels productive and it destroys your baseline. Note it, fix it afterwards.
Alert fatigue is measurable. Track the ratio of alerts to actions taken. If it’s worse than a few to one, the problem is upstream of the people ignoring them.
Specific template names, metric lists and default thresholds vary by integration and version — [VERIFY] against the OpsRamp documentation for the specific technology you’re monitoring, since the template catalogue is large and moves.
Key takeaways
- A template is metrics, thresholds and intervals — and those three cap everything downstream.
- Apply templates through device management policies, driven by the attribute model from discovery.
- Vendor default thresholds are a guess about someone else’s workload. Designing them is the actual work.
- Four mechanisms sit between a threshold and a page: severity, suppression, correlation, forecasting. Use more than one.
- Baseline for two weeks before alerting for real, then tune per group.
- Forecasting turns “disk is full” into “disk will be full on Thursday” — schedule the work instead of reacting to it.
What’s next
Next in this track: O-5 — Hybrid and Multi-Cloud Monitoring. Extending the same model across AWS, Azure and Google Cloud alongside the on-prem estate — what cloud discovery brings in, how cloud resources differ from the infrastructure model, and where the unified view genuinely is unified.
Sources: OpsRamp Documentation · Monitoring and Alerts / template-based monitoring · Platform Features · Resource Management · Discovery · Gateway Deployment Requirements.
Pingback: Hybrid and Multi-Cloud Monitoring – silverX.org