Ninth post in the HPE OpsRamp track. O-8 covered the policy-driven floor of alerting — dedup, suppression windows, escalation chains, templated notifications — and explicitly deferred everything machine-learning-flavored to this post. This is that post: how OpsRamp’s AIOps layer turns a flood of discrete, correctly-triggered alerts into one alert about one probable cause, and how it decides an alert should have fired at all when nobody set a fixed threshold.
What O-8 left on the table
O-8’s boundary was explicit: alert-level suppression, maintenance windows, and escalation policies are things a human configures by hand, and they were the whole post. Machine-learning-based correlation, root-cause clustering, seasonality detection, and predictive suppression were named only to mark where the policy layer stops — not explained. This post picks up exactly there, and the OpsRamp documentation turns out to split that territory into three separate, separately-configured capabilities rather than one monolithic “AIOps” feature: Alert Correlation (grouping), Change Detection (anomaly-based thresholds), and Alert Prediction (seasonality and forecasting). They share a UI section and a permission model, but each is its own policy object with its own on/off switch.
The case for correlation over discrete alerts
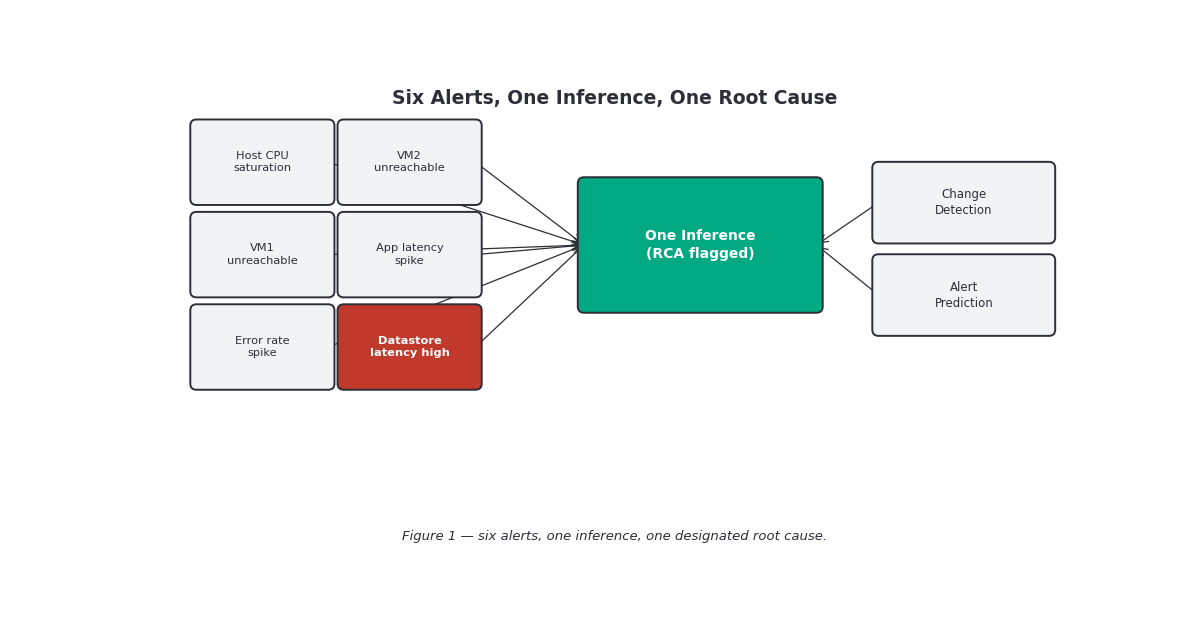
O-8’s alert lifecycle already included a Correlated state, and de-duplication was the first, cheapest noise-reduction layer — collapsing repeats of the same alert. What de-dup can’t do is the case this post opens with: a hypervisor’s host CPU saturates, two VMs on it go unreachable, an application’s latency crosses its threshold, and its HTTP error rate spikes — four different alerts, on four different resources, each individually correct, each independently paging someone. Without correlation, that’s four tickets and four people investigating four symptoms of one cause. OpsRamp’s documented answer is the inference: “a logical grouping of related alerts that have been correlated based on patterns defined in your alert correlation policies.” When alerts match a policy’s rules, OpsRamp groups them under one inference ID automatically — one notification, one incident, instead of one per symptom.
How correlation actually groups alerts
An Alert Correlation Policy is scoped like the escalation policies in O-8 — partner-level or client-level, and site-specific (alerts from different sites are never correlated together). Two matching mechanisms are documented:
- ML sequence (clustering-based) correlation — the system discovers repeated alert sequence patterns by mining roughly the last 90 days of alert history, continuously, without manual configuration. It uses similar attributes across events — problem area (extracted from the alert subject/description via enrichment policies), source-component attributes, naming conventions, IP subnets, and custom attributes — to decide two alerts belong to the same pattern. This is the mode documentation recommends by default: “it is recommended that you rely on machine learning to discover alert sequences to be correlated.”
- Topology-based correlation — where OpsRamp already has dependency mapping for a resource, it correlates alerts using the interrelated metrics of upstream/downstream resources directly — the hypervisor-fails → dependent-VMs-go-unreachable case is the documented example. This is more precise where topology exists, but it depends on that mapping being present, the same structural dependency O-6 found with distributed tracing: the platform’s own effort only goes as far as the data it’s been given.
Both mechanisms operate inside a fixed timing rule, not an open-ended window: alerts correlate only if the gap between adjacent alerts is at most 5 minutes, and the running correlation map extends up to 1 hour from the first alert in the sequence — cross that 5-minute gap once and the map closes; a later alert starts a fresh one. The documented example: alerts at 10:00, 10:04, and 10:07 correlate (each gap ≤ 5 minutes) even though the whole span is seven minutes; an alert at 10:11 would not join that same map because the prior gap already exceeded five minutes at that point.
Root cause, not just grouping
Grouping alerts into one inference solves the noise problem; it doesn’t by itself tell anyone what to fix first. OpsRamp’s documented answer is a manual step layered on the automatic one: within an inference, one alert can be designated as the RCA (root cause alert). Doing so updates the inference’s subject line to reflect the designated cause, flags that alert with a warning icon in the UI, and is capped at one RCA per inference. In the schematic below, “Datastore latency high” is the RCA a responder picked out of six correlated alerts — the platform found the group; a person (or, per the documentation’s own hint below, the model’s own confidence scoring) still points at the cause.
An inference isn’t a dead end once formed: alerts can be removed from it (drop to two remaining and both revert to being standalone alerts), and each inference has its own Incidents tab and detail view — meaning it plugs directly into the same incident workflow O-8’s escalation policies drive, just triggered by a group of six alerts instead of one.
When machine learning needs help: the training file
The documentation is candid that ML discovery isn’t presented as sufficient on its own for every case: an alert correlation training file — a CSV, uploaded per policy — lets an administrator specify sequences explicitly rather than waiting for the model to learn them. Each row is a sequence of alert names in expected order; a * wildcard matches a prefix (vmware.vcenter.* catches every vCenter alert without listing each one), and a leading - on a row inhibits that sequence from correlating instead of enabling it. Documentation frames this as the exception, not the default: useful when you already know two alert types always travel together (or never should), and don’t want to wait 90 days for the model to notice. The Detected Alert Sequence Patterns view is where the two approaches meet — it shows what the ML has learned so far, and lets an operator explicitly learn a pattern it hasn’t caught or unlearn one it shouldn’t have, with changes taking about an hour to propagate into live correlation. That hour-long propagation lag is worth remembering if you unlearn something and expect the next matching alert to behave differently within minutes — it won’t.
Dynamic thresholds: Change Detection versus O-4’s static design
O-4 (this track’s early post on monitoring templates) described threshold design as a manual, per-metric decision — pick a number, pick a duration, pick a severity. Change Detection is OpsRamp’s documented alternative for the metrics that resist that treatment: ones with, in the documentation’s own words, “an indefinite threshold” — no natural fixed number where “fine” ends and “broken” begins.
Mechanically, it’s an online-learning, sliding-window model, not a batch job: a four-hour sliding window computes a metric’s mean and deviation in real time, and at least four hours of history must exist before the policy can alert at all. Sensitivity is set in standard deviations from that rolling mean — High at 3σ, Medium at 4σ, Low at 5σ — with direction configurable (increase only, decrease only, or either), and a metric can additionally be flagged as an availability metric so its deviations feed resource-status evaluation directly. A triggered change-detection alert auto-resolves after four hours without further deviation, rather than staying open indefinitely.
| Static threshold (O-4) | Change Detection (this post) | |
|---|---|---|
| How the trigger point is set | A fixed number/duration you choose per metric | A rolling mean plus a standard-deviation band, computed continuously |
| Best fit | Metrics with a known “safe” ceiling/floor (disk %, CPU %) | Metrics with no natural fixed limit, or that vary legitimately by workload |
| History required before it can fire | None — active as soon as configured | At least 4 hours of data |
| Resolution | Manual, or condition returns below threshold | Auto-resolves after 4 hours without continued deviation |
| Documented limits | None specific | Capped at 25 resources per account; requires a monitor interval of 10-15+ minutes |
The 25-resource cap is worth sitting with: Change Detection reads as a targeted tool for a short list of genuinely hard-to-threshold metrics, not a wholesale replacement for the template-driven static thresholds this track has covered since O-3/O-4.
Seasonality and predictive alerting: Alert Prediction
The most explicitly forward-looking piece is Alert Prediction, described as discovering “seasonality patterns of alerts using machine learning algorithms” and serving as “an early-warning system allowing you to take preventive action in advance of future alerts.” Predicted alerts are organized into seasonal groups, each named from the resource, metric, and alert type it was learned from, and a documented UI view plots historical occurrences (in gray) against forecast future occurrences (in color) along a date-range slider — letting someone see, before it happens, that a given alert has a recurring rhythm.
What the documentation does not spell out is the mechanics: it doesn’t state the detection algorithm, the minimum history window needed to establish a seasonal pattern, or give a worked example of what a seasonal group looks like in practice (a Monday-morning batch job’s disk-I/O alert, a month-end billing run’s CPU spike — the kind of pattern an ops team would recognize immediately, but not one the documentation itself illustrates). The minimum training window and the specific algorithm behind seasonal-group detection before promising a stakeholder a concrete lead time on a predicted alert. Structurally, Alert Prediction is its own policy type — created, viewed, enabled/disabled, edited, and deleted independently of Change Detection and Alert Correlation policies, gated behind the same OpsQ View/OpsQ Manage permissions this track has seen govern escalation and correlation policies since O-8.
First Response: where correlation and prediction meet automation
O-8 named First Response only to mark it out of scope. It’s documented as the layer that takes automated action on newly generated alerts — and notably, only on the alert that starts a sequence, not on later occurrences appended to an existing one. Like correlation and escalation policies, it runs in ON/OFF/Recommend modes, and its Recommend mode explicitly draws on “learned patterns in historical alerts” — the same ML substrate as correlation and prediction, applied to the question of what automated action (not just what grouping) an alert should trigger. It’s the clearest documented point where correlation, prediction, and automated remediation are described as parts of one connected system rather than three unrelated features that happen to live in the same menu.
Gotchas and caveats
Correlation’s timing window is stricter than it sounds. A 5-minute maximum gap is easy to miss on a genuinely slow-building incident — a root cause and its third-order symptom eight minutes apart will not correlate automatically, and will show up as an unrelated standalone alert unless a training-file entry or topology mapping catches it another way.
RCA designation is per-inference and manual (as documented). Don’t assume the platform is picking your root cause for you; treat the “warning icon” alert as an operator’s working hypothesis, confirmed or corrected as the incident unfolds, not a certified diagnosis.
Change Detection is capped at 25 resources per account. It reads as a scalpel for genuinely threshold-resistant metrics, not a wholesale replacement for O-4’s static-threshold monitoring templates — plan which 25 metrics actually need it.
Four hours of silence isn’t the same as four hours of good behavior. Change Detection needs four hours of history before it can alert at all, and it auto-resolves an open alert after four hours without further deviation — a genuinely slow-burning problem that deviates just under the sensitivity band the whole time will neither trigger nor stay flagged.
Alert Prediction’s mechanics are the thinnest-documented part of this post. The seasonal-group concept and the historical/forecast visualization are clearly described; the algorithm, minimum training window, and confidence reporting are not. Treat predicted alerts as a lead worth investigating, not a committed forecast, until you’ve validated a few against your own environment.
The correlation training file is explicitly the exception path. Documentation recommends relying on ML discovery first; reach for a training file only for sequences you already know and want to force (or explicitly inhibit) rather than as a default configuration step.
Key takeaways
- OpsRamp’s AIOps layer is three separate policy types, not one feature: Alert Correlation (grouping), Change Detection (dynamic, deviation-based thresholds), and Alert Prediction (seasonality/forecasting) — each independently enabled, gated by the same OpsQ permissions as O-8’s escalation policies.
- Correlation groups alerts into an inference using ML-discovered sequence patterns (mined from ~90 days of history) and/or topology-based dependency mapping, within a 5-minute gap / 1-hour window rule; one alert per inference can be designated as RCA.
- A CSV training file lets you force or inhibit specific sequences explicitly, as a documented exception to relying on ML discovery.
- Change Detection is a 4-hour sliding-window, standard-deviation-based dynamic threshold (3σ/4σ/5σ sensitivity) for metrics with no natural fixed limit — capped at 25 resources per account, distinct from and complementary to O-4’s static monitoring-template thresholds.
- Alert Prediction discovers seasonal groups and forecasts recurrence as an early-warning system — the clearest predictive capability in the platform, but the thinnest on documented mechanics.
- First Response is the automation layer that ties correlation and prediction’s learned patterns to automated first actions on new alerts.
- Several specifics are whether RCA designation can be automated, and Alert Prediction’s minimum training window and underlying algorithm.
What’s next
Next in this track: O-10 — The GenAI Operations Copilot. This post covered OpsRamp’s structured, model-driven AIOps layer — correlation, anomaly thresholds, seasonality. O-10 looks at the generative-AI layer on top of it: a conversational interface for querying and acting on the same alert, incident, and inference data covered here.
Sources: OpsRamp Documentation · Alert Correlation · Alert Correlation Policies · Alert Correlation Training File · Detected Alert Sequence Patterns · Inferences · Manage Change Detection · Alert Prediction · View Predicted Alerts by Seasonal Groups · First Response · Control the Chaos with OpsRamp AIOps.